EntoVision

Insect populations, measured continuously.

Whether the trap is in a field, a warehouse, or a research plot, EntoVision turns it into a source of structured data. Cameras above, software around them, and a dashboard that surfaces what you couldn't see before.

A wide scene showing three field traps with insects flying in and landing, data streaking to a central platform hub, and three insight panels populating on the right. FIELD PLATFORM INSIGHTS DETECTIONS TODAY 1,247 ↑ 12% SPECIES IDENTIFIED 14 B. dorsalis S. litura, 12 more ACTIVITY RHYTHM 24h Cameras above traps capture insects on schedule Images sent and processed in the cloud Counts, species, and patterns over time

What it does

A camera above every trap. A continuous record of what shows up.

EntoVision puts a small, battery-powered camera unit above any trap or collection surface. That could be a sticky trap in a field, a pheromone trap in a warehouse, or a light trap at a research site. The camera takes a picture on schedule, sends it over the cellular network, and writes the result into a dashboard you can actually use.

Over a season, one trap produces a few thousand timestamped images. Across a hundred traps and a year, you have a dataset large enough to see patterns that nobody has been able to measure at this resolution before.

An EntoVision light-trap unit deployed in a wooded field site, mounted on a campus marker post with forest visible behind.

In the field

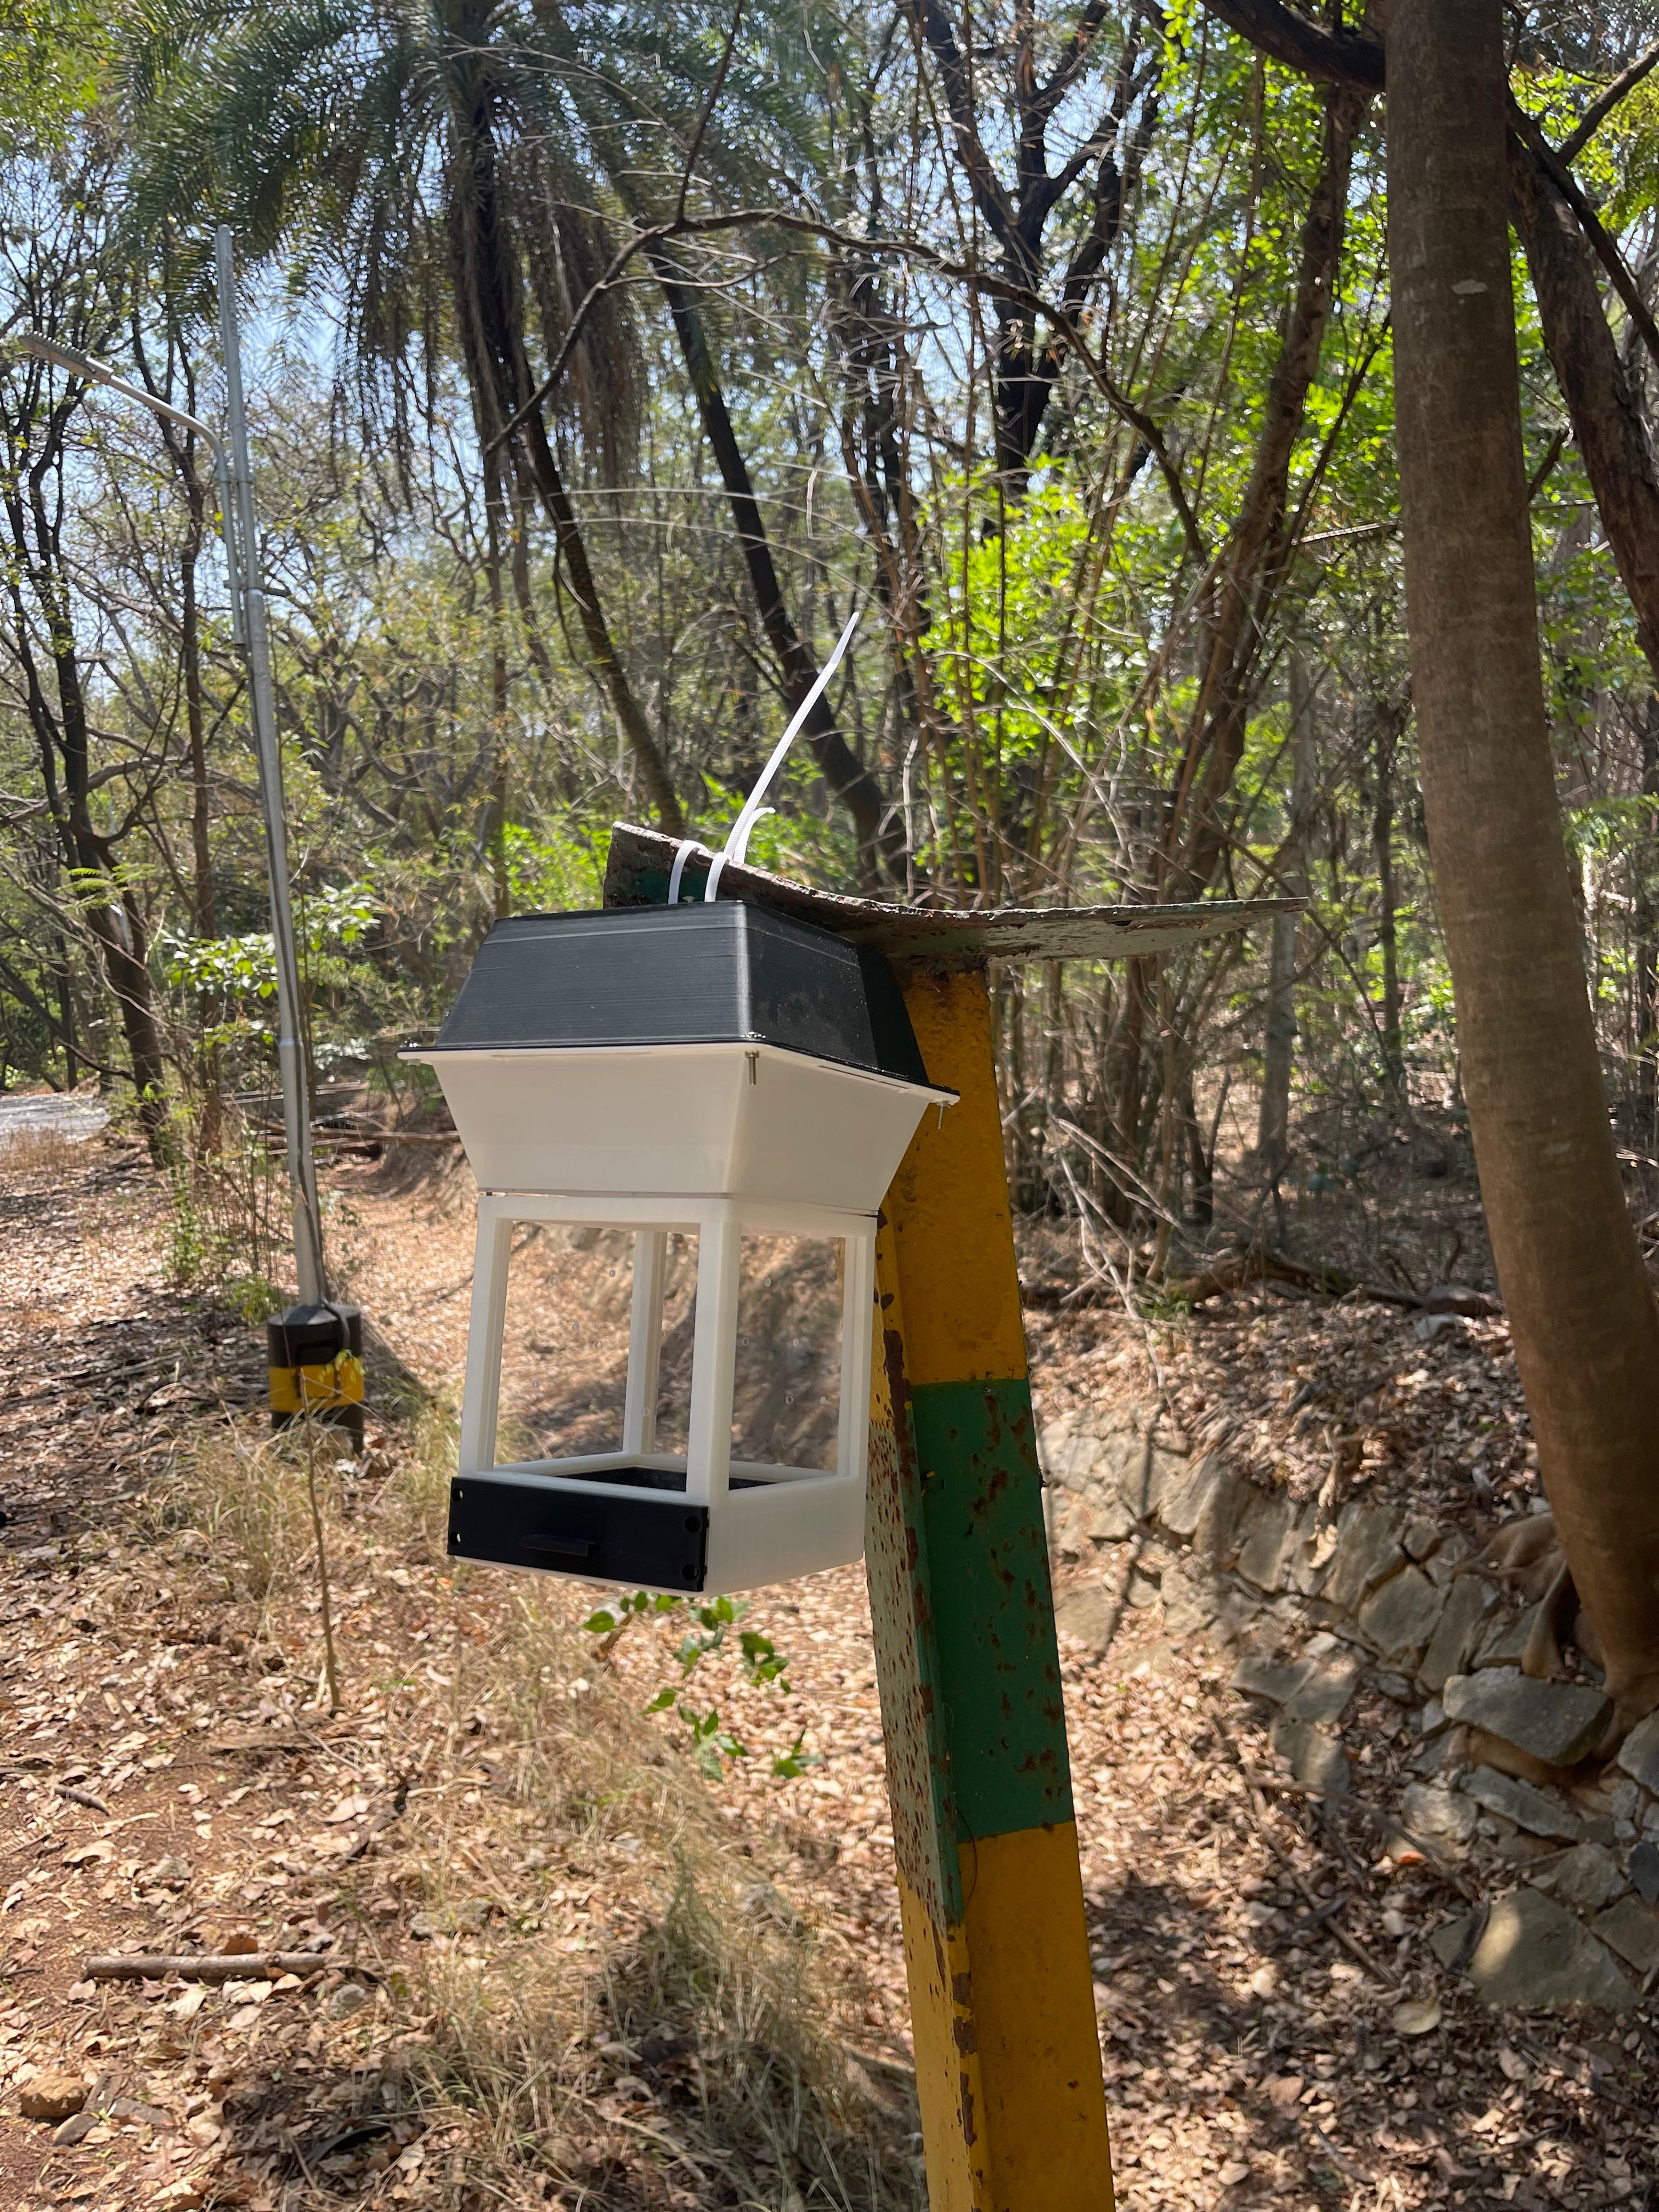
Built to be installed where the data is.

The unit runs on a lithium battery, transmits over the cellular network, and needs no power infrastructure at the site. Mounted in a few minutes on standard trap supports, posts, or existing structures, whether that's an orchard row, a warehouse wall, or a transect in the forest.

Why we built it

Most insect data is collected by hand, and it shows.

Trap inspection has always been a manual job. Someone walks to the trap, counts what's on it, writes it down, and walks to the next one. Frequency is low because labour is expensive. Records are sparse because counting takes time. Two people looking at the same trap can disagree on what they see.

That gap costs different people in different ways. Growers miss the rising edge of an outbreak. Warehouse managers find the infestation only after the stock is damaged. Scientists work from sample sizes too small to answer the questions they actually want to ask. Advisory bodies issue warnings late, or not at all.

EntoVision changes what's measurable. The hardware captures the same view of the same trap, on the same schedule, every day. You end up with thousands of entries per site, all in the same format, and that's what makes everything else possible.

Trap-agnostic by design

One platform. Whatever trap you're already using.

We didn't build a branded trap. The camera works above whatever collection surface you already trust, and produces the same kind of measurement regardless of what's underneath.

Sticky traps
Thrips, whiteflies, leafminers
Pheromone-baited
Moths, fruit flies, weevils
Light traps
Nocturnal sampling
Pitfall arrays
Ground arthropods
Custom surfaces
Whatever you design for your site

The same capture protocol applies everywhere. The same dashboard surfaces the data. The same comparisons become possible across sites, seasons, and crop or storage contexts.

Who it's for

Built for the people making decisions about insects.

Insect populations matter to many kinds of work, and the same underlying data serves all of them. EntoVision is shaped for four audiences in particular.

For fields and farms
Growers and farm managers
See pest pressure building before it shows up in the field, so you can spray at the right time and scout the blocks that need it. A continuous read instead of weekly rounds.
For warehouses and storage
Inventory and storage operators
Catch stored-product infestations early, before the damage compounds. The same continuous monitoring works for grain godowns, cold storage, processing units, and export warehouses.
For research and ecology
Scientists and field teams
Build longitudinal datasets at scales that manual sampling can't reach. Compare populations across sites and seasons. Annotate and export the full record when you need it.
For advisories and decision-makers
Extension officers and program leads
See regional pest dynamics in time to act on them, not after the fact. Plan interventions and report outcomes with data that wasn't available a year ago.

Different views for different work

Insights layered by role.

The same data is useful in different shapes to different people. Someone on the ground wants to see individual frames and current counts. Someone managing many sites wants the aggregate view. Someone writing a report wants a clean summary they can share. EntoVision shows each of these from the same underlying data.

Operators and field teams

Individual traps, image by image. Current counts, recent captures, and the time-series for every site you're responsible for. Annotate or reclassify when you need to, export when you're done.

Managers and program leads

All the deployments across your organisation. Add devices, control who sees what, and produce the aggregate reports that go to your stakeholders.

Decision-makers and reviewers

Read-only views of the data your organisation is generating. Clean visualisations, current status, exportable summaries. For people who need to see the picture without changing it.

Each role sees what's useful to them, and nothing more.

Access

Currently invite-only.

EntoVision is in early deployment with a small group of partners across horticulture, storage, and research. If your work involves insect populations and you'd like to evaluate the platform, get in touch and we'll talk.